Chemical reaction control: tools enabling automated process monitoring and control
Learn about Process Analytical Technology (PAT) and inline tools for monitoring and controlling chemical reactions. This article covers benefits, limitations, selection criteria, and validation.

In brief
- The endpoint of a chemical reaction is a critical process parameter with impacts on plant safety and availability, product quality, and product yield.
- Traditional approaches to endpoint monitoring do not account for batch-to-batch variability, resulting in sub-optimal process operations.
- Process Analytical Technology (PAT) is widely used in the chemical industry to implement manufacturing approaches such as automated process control.
- PAT encompasses physical, non-specific chemical, and specific chemical analyses: Coriolis flowmeters provide rapid trending of bulk properties such as density and viscosity, while Raman spectroscopy analyzers deliver specific information about the composition and concentration of multiple chemical components.
- The use of PAT in reaction endpoint monitoring has proven application and business benefits including understanding when to stop a reaction and why, reduced batch-to-batch variability, improved plant availability, and consistent product quality.


Introduction
Why understand a chemical reaction’s endpoint?
A chemical reaction’s endpoint is a critical process parameter for safety, product quality, and plant efficiency purposes. A reaction that runs beyond its endpoint risks formation of unstable or reactive byproducts, unnecessarily uses power, and decreases plant efficiency. A reaction that stops early risks a lower product yield that would necessitate more batches to obtain the desired annual production. Thus, a reaction’s endpoint needs to be closely controlled. But even a well-characterized reaction has slight batch-to-batch differences in its endpoint because the reaction can be affected by the quality of incoming materials, changes in environmental pressure and temperature, and catalyst quality. Despite the dynamic conditions that affect every batch reaction, most reaction endpoints are not measured in real time. Instead, the endpoint is based on time-based protocols, mass-balance models, or offline measurements. These traditional approaches only give late decisions, after the chemistry is completed. Process Analytical Technology (PAT) tools are an alternative to traditional approaches that bring real time information, ability to integrate into automation platforms, and provide 24/7 hands-free measurements.
What is Process Analytical Technology (PAT) in Chemical?
A 2025 article on PAT by Esmonde-White and Uerpmann reviewed the history of analysis in the chemical industry. Process Analytical Chemistry (PAC) was introduced in the 1980’s with the use of process infrared (IR), process near-infrared (NIR), and at-line gas chromatography (GC). By 2011, PAC tools extended to microanalytical systems, sampling systems, mass spectrometry (MS), flow injection analysis, process Raman spectroscopy, and process chemometrics . PAC concepts were adopted by the pharmaceutical industry as Process Analytical Technology (PAT) in 2004 as a framework to encourage innovation in pharmaceutical manufacturing.
PAT solutions are intended for understanding bio- and chemical processes with a goal to control quality at all stages of product manufacturing and achieve quality by design (QbD). An important goal of PAT implementation is to promote real-time release of products to decrease the cycle time and cost of production. This framework is meant to shift manufacturing to a risk-based approach where “quality should be built into a product with a thorough understanding of the product and process by which it is developed and manufactured along with a knowledge of the risks involved in manufacturing the product and how best to mitigate those risks.” The pharmaceutical industry has embraced the PAT framework, which has moved the field of inline analysis forward with Quality by Design (QbD), and Industry 4.0 concepts that have been proven to reduce time to market and improve manufacturing robustness. Advancements in PAT and QbD practices can benefit the Chemical industry particularly as the industry reexamines inline analyses, adopts more automated plant control strategies, and aims to maximize plant efficiency.
Types of PAT tools for chemical reaction monitoring
It is important to think of PAT as a toolbox because there is not a single measurement that can address the needs of every batch unit operation. A variety of analyzers and sensors comprise the tools of PAT and they can be installed in locations such as laboratory, at-line, or inline. Specifically for inline purposes, analyses include physical process parameters and chemical process parameters. Physical parameters such as flow, level, pressure, and temperature provide necessary information on the process’s physical operation. Color, pH, conductivity, turbidity, density, and viscosity provide non-specific information on the bulk sample chemistry. Analyzers complement physical and non-specific chemical measurements. Inline chromatography, vibrational spectroscopy, or optical analyzers provide specific chemical identification that can infer physical or chemical properties. Vibrational spectroscopy includes near-infrared (NIR), infrared (IR), and Raman spectroscopy. These techniques can measure the chemical composition and molecular structure of sample. They are generally non-destructive and can be installed in a variety of laboratory or process environments. The breadth of PAT tools enables a “fit for purpose” approach to process measurements for most chemical reactions and post-reaction processing steps that includes:
- Physical parameters that report on process health include flow, level, pressure, and temperature
- Non-specific chemical parameters of density, viscosity, pH, and conductivity report on bulk material chemical properties
- Specific chemical information on multiple components via spectroscopic analyzers such as Raman, infrared (IR), or absorption spectroscopy
How PAT improves reaction endpoint monitoring
When reaction progress is confirmed mainly through manual sampling and offline lab analysis, the process continues while teams wait for results, or operators extend the batch just to be safe.”This drives longer batch cycles, lower utilization, and more variability.
What “reaction control” typically means in operations:
- Endpoint detection: stop/quench at the right moment to avoid premature stops, overprocessing, or a runaway reaction
- Reaction progress trending: track conversion trajectory during the batch
- Deviation detection: identify drift from expected behavior early enough to correct
Real-time measurements enable more precision about the reaction’s progress and allow the user to dynamically control the process or correct for process deviations. For these reasons, inline measurements are preferred in the chemical industry for reaction endpoint monitoring and control. Two examples of Coriolis flowmeters and spectroscopy highlight the breadth, varying degrees of specificity, and versatility of inline PAT tools for reaction endpoint monitoring.
Coriolis density and viscosity measurement for reaction monitoring
Using Coriolis flowmeters to measure viscosity or density
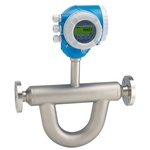
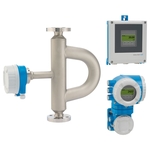
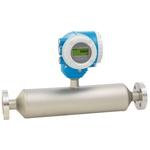
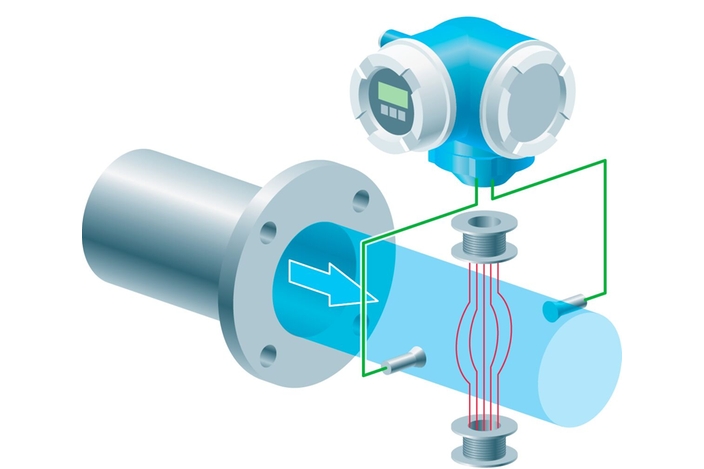
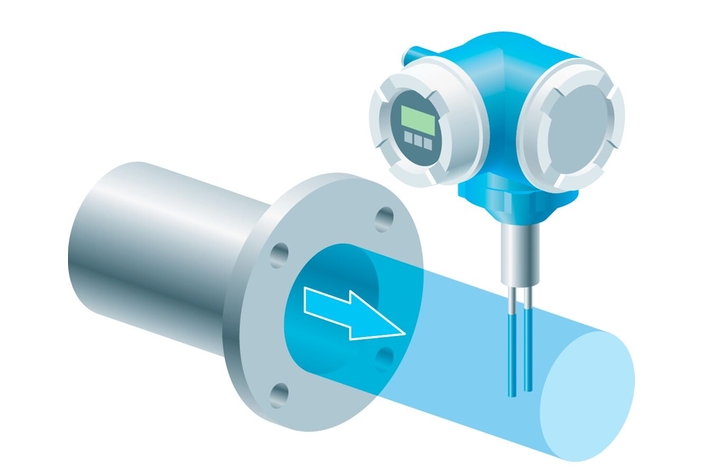
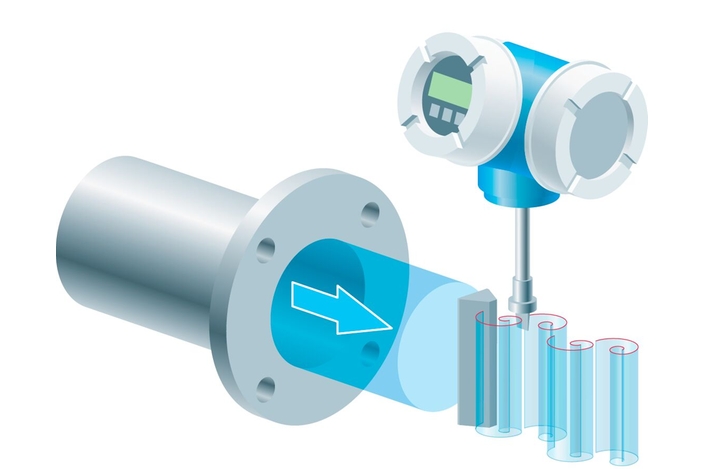
A liquid’s movement through a pipe depends on the fluid properties of viscosity, density, surface tension, and lubricity. Coriolis flowmeters are widely used to measure mass flow in Newtonian fluids such as gasoline, alcohol, juice, or liquid chemicals and non-Newtonian fluids such as ketchup or yogurt. The measurement principle of a Coriolis flowmeter is based on the rotary motion of liquid in a measuring tube and the resulting tube’s resonance with flowing liquid will change depending on the fluid’s properties. Changes in the resonance frequency indicate changes in density, and changes in the energy needed to maintain the tube’s vibration indicate changes in viscosity. During a chemical reaction, the fluid will change in its density and/or viscosity relative to the reaction’s start point. At the reaction endpoint, the density and/or viscosity will reach a steady state and that steady state is a possible indication that the reaction is stalled or complete.
How density or viscosity is used in reaction monitoring
The fluid properties of viscosity or density may be a non-specific indication that a chemical reaction is stalled or completed. The time lapse measurement provides a quick trending of the bulk liquid properties of the reaction liquid. Unexpected and quick changes to the bulk liquid properties could be a real-time indication of a process excursion while the reaction is ongoing. Steady-state values could indicate the end of the reaction or a stalled reaction. Figure 1 shows an example of biodiesel transesterification where online monitoring with a Coriolis flowmeter identified the reaction endpoint after only 15 minutes. By comparison, literature reports for off-line endpoint determination typically start at 30 minutes, with reaction times often extending significantly longer. These results suggest that inline density measurement could help reduce reaction times and enable faster process decisions.


Figure 1: Density and conversion over time during biodiesel transesterification. Online density measurement with a Coriolis flowmeter was validated against GC analysis.
Viscosity can provide complementary insight when changes in material behavior are quality relevant. However, viscosity interpretation depends strongly on fluid rheology and comparability to lab methods. Inline viscosity is often used for trending/repeatability purposes in non-Newtonian fluids since there are measurement challenges that preclude “lab equivalence”.
Typical measurement configuration
In chemical batch contexts, continuous density or viscosity measurement is most easily achieved by using a Coriolis mass flowmeter installed in a slip stream. Slip streams, or recirculation streams, are commonly employed in the chemical industry as a convenient and safe way to collect samples for laboratory analysis without opening the reactor.
Raman spectroscopic analyzers for chemical reaction monitoring
Using Raman spectroscopy to measure chemical components
Raman spectroscopy measures a chemical fingerprint of a sample and, in a chemical reaction, can measure both the reactants and products simultaneously.
How Raman spectroscopy is used in reaction monitoring
Raman spectroscopy is useful for three main industrial purposes: qualitative (identification), quantification (how much), and monitoring and controlling change. For qualitative uses, molecular spectroscopy can identify the chemical composition of a material and molecular structure. The identification usage of molecular spectroscopy is broadly applied to measure composition of solids, liquids, or gaseous materials for:
- Understanding multiple aspects of a complex material
- Understanding polymer molecular structure such as cis or trans isomerization
- Identifying contaminants in a mixture
For quantification uses, molecular spectroscopy can provide the concentration of single or multiple components or the ratio of those components. The quantification capabilities can be used to monitor change of a process, which is especially useful for determining when to end a processing step or when to add more ingredients to a long-running process. Quantification by molecular spectroscopy can be applied to solids, liquids, and gases. Some examples of quantification or change monitoring by molecular spectroscopy include:
- Measuring feed and byproducts
- Monitoring the relative amount of starting material and end material in a chemical reaction. Figure 2 shows an industrial example where Raman-based endpoint determination saved over 2 hours of reaction time compared to off-line HPLC.


Figure 2: Raman-based endpoint determination compared to off-line HPLC for monitoring the relative amount of starting material and end material in a chemical reaction.
Finally, quantification and change monitoring can lead to process control applications. Some examples of process control applications include:
- Integration of multivariate analysis to understand and monitor several components in a mixture
- Automated timing for adding new material media
- Stopping a processing step based on the amount or quality of the product formed
Typical measurement configuration
Raman spectroscopy can be installed directly in a reactor, in a slip stream, an at-line control room, or a laboratory. Compared with other spectroscopy analyzers, Raman spectroscopy offers several unique advantages, including the ability to measure in aqueous media without a defined pathlength, relative insensitivity to particle size, and compatibility with solids, liquids, gases, or turbid media.
How to select the right PAT tool for reaction control
Selecting a PAT tool for reaction measurements is a multistep evaluation that starts in a laboratory. Analytical development is an important part of developing a new chemical process, and occurs in tandem with the process development. These two development activities are iterative and involve a multidisciplinary team of process engineers, chemists, and analytical chemists. Understanding the application need and the required specificity and precision is the first step in PAT selection. One example of an application need in chemical reaction monitoring is knowing if a reaction is stalling, and requires additional charge of catalyst or reactant, with a precise measurement of the reactants to 0.3%. Another example of an application need is whether the batch is deviating from the “golden batch” trajectory within three minutes.
The next step is to assess which possible PAT could meet the application need. Assessing possible PAT tools is performed at multiple scales. Initial testing is in the laboratory at small scale under tightly controlled environments, and candidate PAT analyses are compared against reference measurements such as titration, high-pressure liquid chromatography (HPLC), or GC to determine if the signal correlates to reaction progress, process upsets, or changes in the environmental conditions.


Figure 3: The technological, serviceability, and integrations are important aspects to consider when looking to bring PAT into a plant.
Analyses that show promise at the laboratory scale are brought into a pilot test for scale-up, and then to the plant scale for trial. If each of these steps is successful, then then PAT is integrated for manufacturing at the plant. This lab-to-process development paradigm is used for all PAT because it is important to understand how a PAT signal corresponds to critical process parameters and whether the PAT will scale as it moves from the laboratory into manufacturing. The required effort for PAT development, calibration, and maintenance are additional considerations in selecting a PAT that inform on suitability in an operations context.
PAT selection criteria for process engineers
The following boxes show several important aspects in choosing a PAT. A PAT strategy may incorporate one or several analyses in one unit operation in order to achieve both a quick trending of bulk chemistry for rapid measurements and a highly specific fingerprint of critical chemical components. This hybrid approach provides a rich multivariate description of the process, and this approach provides the most benefits. With a hybrid PAT approach, the data are not only used in real-time to ensure batch-to-batch consistency and correct off-spec processes in real time but also to troubleshoot if a process deviation was observed after the reaction.
Coriolis flowmeter
-
Measured attribute(s)
Physical attribute: mass flow; chemical attribute(s): density and/or viscosity
-
Ideal for
Quick trending of bulk chemistry in a process time course
-
Development
Correlate profiles to offline reference analysis; define threshold/plateau criteria
-
Compatibility with plant automation
Yes, via standard communication protocols
-
Operational validation
Model validation lifecycle management
-
Instrument and model calibration
Model and flowmeter calibration at defined intervals
-
Common failure mode
Correlation breaks if physical or chemical changes result in a density or viscosity beyond validated range
Spectroscopy
-
Measured attribute(s)
Chemical attributes: Composition and molecular structure of multiple components
-
Ideal for
Highly specific trending or quantification of multiple components
-
Development
Correlate profiles to offline reference analysis; define threshold/plateau criteria
-
Compatibility with plant automation
Yes, via standard communication protocols
-
Operational validation
Model validation lifecycle management
-
Instrument and model calibration
Model and instrument calibration at defined intervals
-
Common failure mode
Model drift from changes to reference analysis, non-representative sampling, contamination of probe window, or deviations from offline sampling protocols
Frequently asked questions about PAT and reaction monitoring
References
- FDA: PAT — A Framework for Innovative Pharmaceutical Development, Manufacturing, and Quality Assurance [fda.gov].
- Spectroscopy Online: Process Analytical Technology (PAT) Model Lifecycle Management [spectrosco...online.com].
- Esmonde-White, KA and Uerpmann, C; Process Analytical Technology and the Role of Raman Spectroscopy, Chemical Engineering, 2025, Vol 132, Issue 9, p40.
- R.J. Hart, N.I. Pedge, A.R. Steven, K. Sutcliffe. “In situ Monitoring of a Heterogeneous Etherification Reaction Using Quantitative Raman Spectroscopy”. Org. Process Res. Dev. 2015. 19(1): 196–202. 10.1021/op500027w.